
Dashboard development for contractors and distributors
We build Power BI, Tableau, and Looker Studio dashboards around the decisions your team makes every week, connected to live data and designed to be read in under a minute.

When it's time for real dashboards
Built-in reports in field service and accounting software answer the questions the vendor expected. Your business has its own.
- Monday reporting takes someone half a day of exporting and pasting
- Managers ask for the same numbers every week
- Your software's built-in reports don't answer the questions you actually have
- Leadership wants one view across jobs, branches, or brands
Dashboards we build
Each one is designed around specific decisions, not a wall of charts.
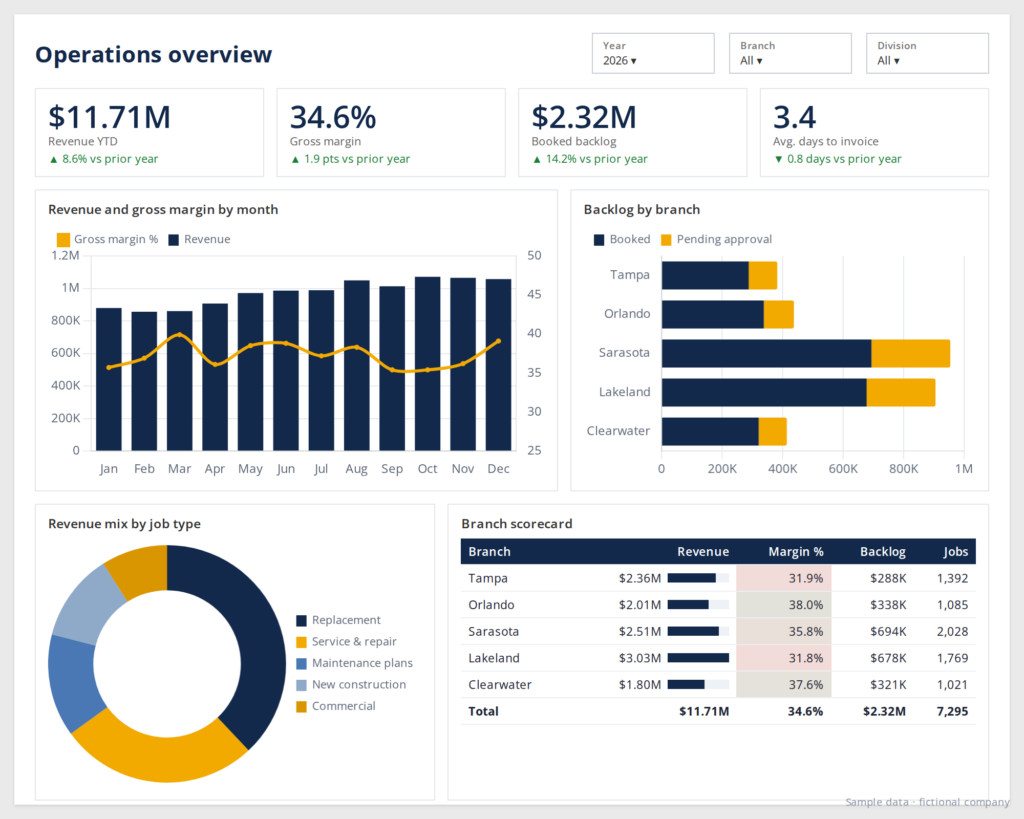
Executive overview
Revenue, margin, cash, and backlog on one screen for owners and leadership.
Operations
Jobs, technicians, dispatch, and productivity for the people running the day.
Sales and pipeline
Leads, close rates, estimates, and reps, from first call to signed job.
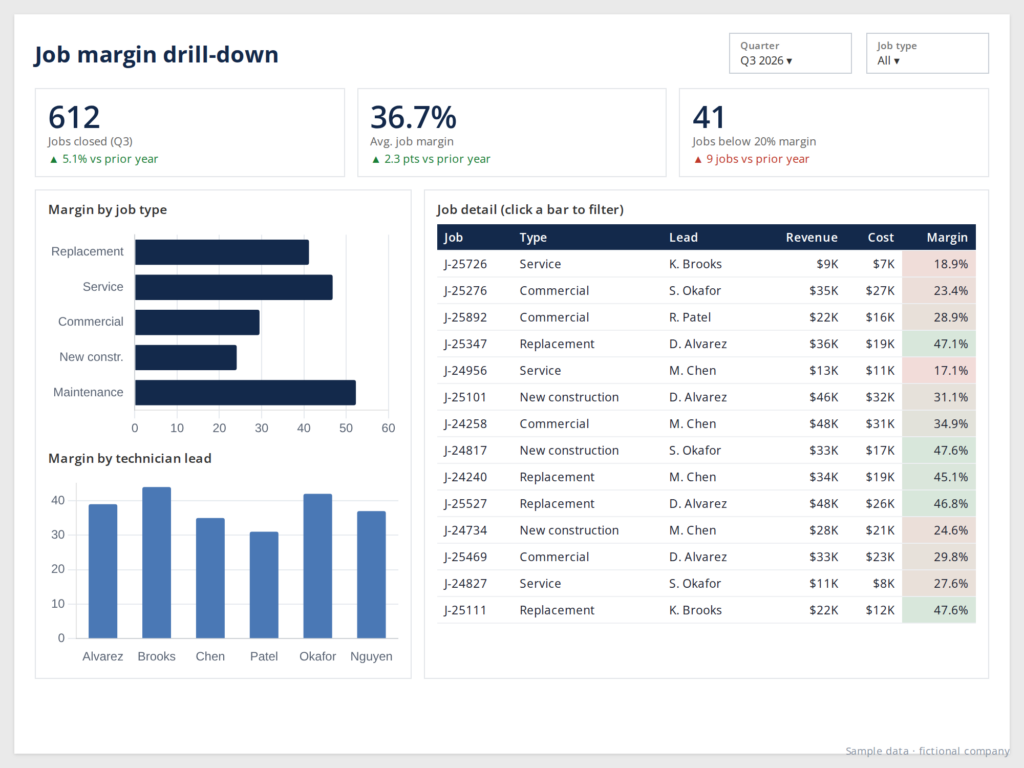
Financial and margin
Gross margin by job, customer, product line, or branch, reconciled to accounting.
Drill-down and filters
Start at the company level and click down to a single job or invoice.
Mobile layouts
Versions sized for phones, for owners and managers who live in the truck.
Questions your dashboards should answer
We start every build with the questions, then work back to the data. A few we hear constantly:
- What is gross margin by job, technician, and branch this month?
- How much backlog is booked against available crew capacity?
- Which customers are slow to pay, and how much is past due?
- Which top customers or products are trending down?
How a dashboard build works
1
Define the decisions
We agree on who uses the dashboard and what they need to decide with it.
2
Wireframe with real data
You review a rough layout using your actual numbers, not lorem ipsum.
3
Build and review
We build in rounds with review sessions so changes happen before launch.
4
Launch and train
We publish, set up refresh and sharing, and train the people who’ll use it.
Common questions
Have a different question? Ask us directly.
Which tool should we build in?
Usually the one that fits what you already pay for. Microsoft 365 companies tend to land on Power BI, Google Workspace companies on Looker Studio. We’ll recommend one and explain why.
Can we view dashboards on our phones?
Yes. We build mobile layouts for the views people check from the field.
What if our data is messy?
Most data is. Light cleanup is part of the build. If it needs more, we’ll say so up front and scope the modeling work separately.
Related services
One definition for every metric, so reports finally agree.
Automated data movement into one central, historical warehouse.
Ongoing support so reporting keeps running and growing.
Start with a data audit
We’ll review your systems and current reports. You’ll leave with a clear plan for what to build first, whether we build it or not.
Prefer email? [email protected]