
Business intelligence for trade contractors and distributors
Uncanny Analytics connects your field service, accounting, and inventory systems into dashboards your team will actually open. We build on Power BI, Tableau, and Looker Studio, and document everything so you’re never locked in.

Questions owners bring to the first meeting
- Which jobs actually made money last quarter, after labor and callbacks?
- Which technicians close the most replacement work?
- Where is cash sitting in slow-moving inventory?
- Which accounts haven't reordered in 90 days?
- Is our membership program paying for itself?
The answers are usually already in your systems. They just aren’t in one place yet.
The real competitor is the spreadsheet you rebuild every Monday
Most trade and distribution businesses aren’t choosing between BI vendors. They’re choosing between fixing reporting now and putting it off another quarter. Waiting has a cost. It just never shows up on an invoice.

Reports that take days
Someone exports from three systems, pastes it into Excel, and fixes the formulas that broke since last month. By the time the numbers land, the decision has already been made.
Systems that don't talk
Your field service software, accounting package, and ERP each tell part of the story. Nobody sees margin by job, by tech, or by customer, because the data lives in different places.
Decisions made on feel
Experience matters, but gut calls on pricing, hiring, and purchasing get expensive as you grow. Good dashboards don’t replace judgment. They give it better inputs.
What we build
Every engagement is scoped up front with defined deliverables. Start with an audit, or bring us one specific problem to solve.
Data audit & roadmap
We inventory your systems, check data quality, and map the reports you need to the data you have. You get a prioritized roadmap whether or not you hire us to build it.
Dashboard development
Executive, operations, and sales dashboards in Power BI, Tableau, or Looker Studio, designed around the decisions your team makes every week.
Data modeling & SQL
Clean data models, DAX measures, and SQL that make numbers match across reports, so finance and operations stop arguing about whose figure is right.
Data pipelines & warehousing
Automated extracts from your field service, accounting, and ERP systems into one central warehouse, refreshed on schedule without anyone exporting a CSV.
BI platform migration
Moving from Tableau to Power BI, or from Google to Microsoft? We audit, rebuild, test, and train, so reports arrive accurate and people keep using them.
Managed analytics
Ongoing support for refreshes, new reports, and fixes when a source system changes. A standing team for businesses that don't need a full-time analyst.
Every build also includes training sessions and written documentation for your team. See training & documentation
Built for businesses that run on trucks, techs, and inventory
We focus on operations-heavy companies where margin is won or lost in the field and on the warehouse floor.

Job profitability, technician performance, membership revenue, and call-to-close rates from ServiceTitan, Housecall Pro, and similar platforms.
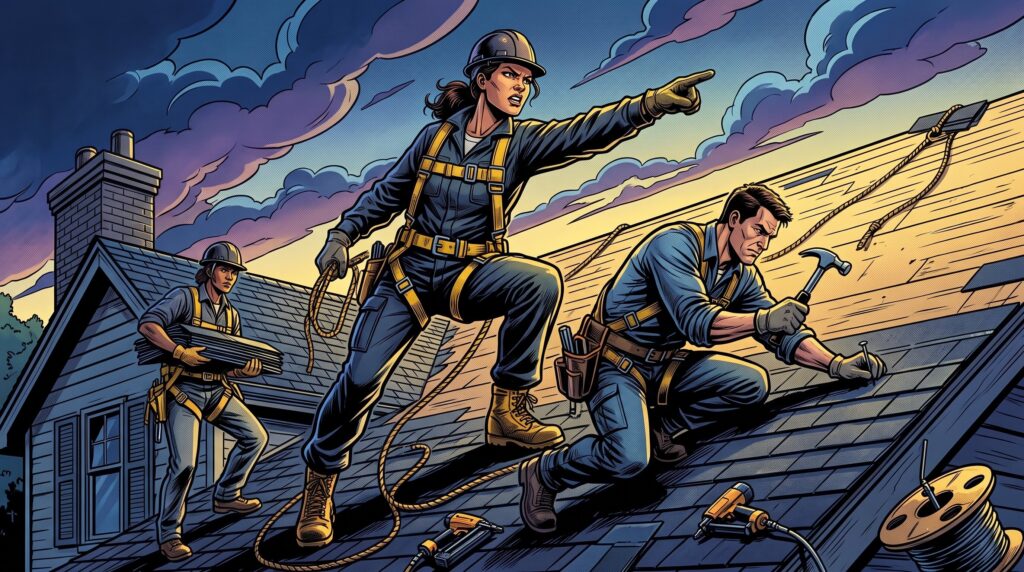
Job costing, work in progress, backlog, and estimate-to-actual variance for roofing, specialty, and general contractors.

Inventory turns, dead stock, fill rate, customer reorder patterns, and margin by product line and branch.

Branch-by-branch comparisons, dispatch efficiency, and company-wide rollups for owners running more than one location or brand.
Microsoft or Google? We work in both.
Most consultants specialize in one ecosystem. Your business probably runs on pieces of each: QuickBooks in one place, Google Workspace in another, a Microsoft 365 license nobody fully uses. We build on whatever fits your stack and budget, and we’ll tell you plainly when a simpler tool will do.
Our work is anchored in vendor-neutral foundations like SQL, PostgreSQL, and Python, so your data model outlives any single dashboard tool.
Dashboards & reporting
- Power BI
- Tableau
- Looker Studio
- Excel & Google Sheets
Data & pipelines
- SQL Server & Azure SQL
- Google BigQuery
- PostgreSQL
- Python
How an engagement works
1
Audit
We review your systems, data quality, and current reports, then talk with the people who use them every day.
2
Roadmap
You get a written plan: which dashboards to build first, what data work they need, and what each phase includes.
3
Build
We work in short cycles with review sessions, so you see real numbers early and revisions happen before launch, not after.
4
Hand off or support
Training and documentation come with every build. Run it in-house, or keep us on for ongoing support.

Senior-level work without big-firm overhead
Large advisory firms do good work for companies that need tax, audit, and consulting under one roof. If what you need is reporting that works, a specialist gets you there faster.
You talk to the builder
The person scoping your project is the person building it. No handoffs between sales, a project manager, and a team you never meet.
Fixed scope, defined deliverables
You know what you’re getting before work starts. Changes are discussed and agreed up front, not discovered later.
No lock-in
Every build ships with documentation and training. If you ever want to bring it in-house or switch providers, you can.
Built for operators
We design for owners, operations managers, and branch leads, not data teams. If a dashboard needs a manual, we redesign it.
Common questions
Don’t see yours? Send us a question and we’ll answer it directly.
Do we need a data warehouse to get started?
Not always. Many first dashboards connect directly to your source systems. A warehouse becomes worth it when you’re combining several systems, need history your software doesn’t keep, or reports start slowing down. The audit tells you which situation you’re in.
Which BI tool should we use: Power BI, Tableau, or Looker Studio?
It depends on what you already pay for and who needs to see the reports. Power BI fits companies on Microsoft 365, Looker Studio fits Google Workspace businesses that want to keep costs low, and Tableau suits teams that already own it or need deep visual analysis. We recommend based on your stack, not our preference.
What systems can you connect to?
Most field service, accounting, ERP, and CRM platforms that offer an API, database access, or scheduled exports. That commonly includes ServiceTitan, QuickBooks, Sage, NetSuite, Acumatica, HubSpot, and Google Sheets. If a system can’t get data out, we’ll tell you during the audit.
How long does a dashboard project take?
A focused dashboard built on clean data can be ready in a few weeks. Projects that need pipelines, a warehouse, or significant data cleanup take longer. Your roadmap includes a timeline for each phase.
Will our team be able to maintain it?
Yes. Every build includes documentation, and we run training sessions for the people who will use and update the reports. Ongoing support is available but never required.
Do you only work with trades and distribution companies?
That’s our focus, but the same work applies to most operations-heavy small and mid-sized businesses, including manufacturers, logistics providers, and multi-location service companies. If we’re not the right fit, we’ll say so.
Start with a data audit
We’ll review your systems and current reports. You’ll leave with a clear plan for what to build first, whether we build it or not.
Prefer email? [email protected]