Inventory and sales analytics for wholesale distributors
Distribution margin hides in the details: slow-moving SKUs, customer-specific pricing, and branches that order differently. We build analytics that show where cash and margin actually sit.
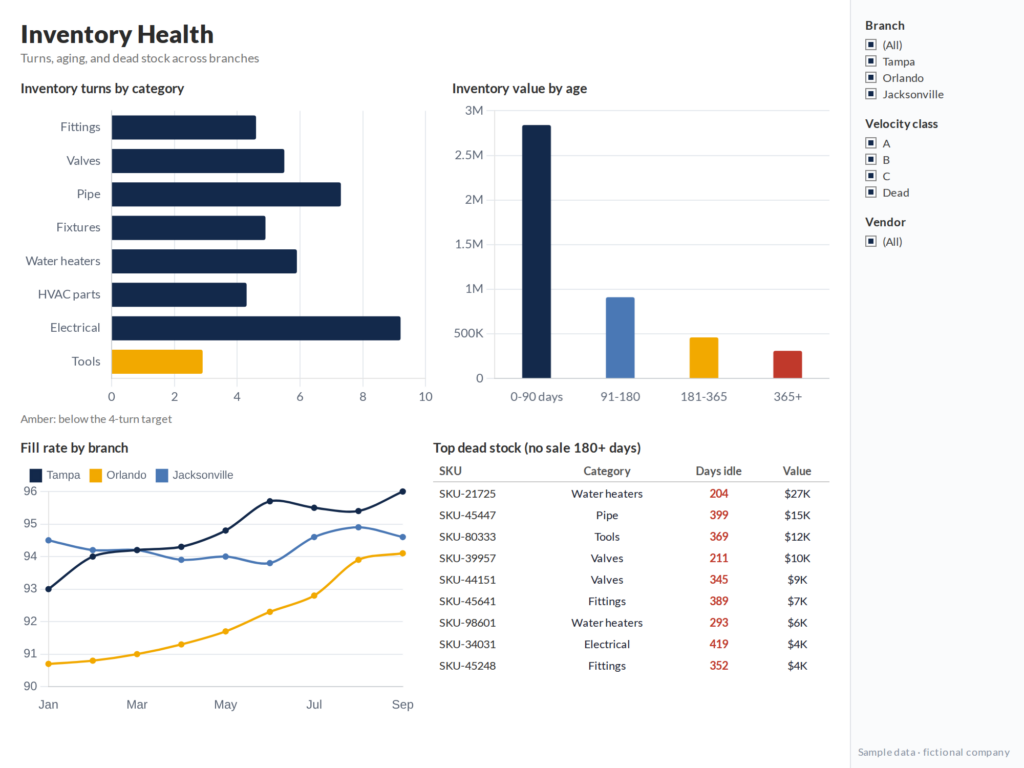
Dead and slow-moving inventory sits for months before anyone flags it.
Pricing exceptions erode margin
Customer-specific pricing and rep overrides add up without anyone seeing the total.
Customers drift away quietly
A customer who stops reordering rarely calls to say so.
Metrics we build dashboards around
A starting point. Every business gets its own mix.
Inventory
Turns by SKU and category
Dead and slow-moving stock
Fill rate and backorders
Days on hand
Vendor lead times
Sales and customers
Margin by customer, rep, and product line
Reorder gaps
Price realization
Sales rep performance
Branch comparisons
Systems we commonly connect
We commonly work with distribution ERPs including Epicor Prophet 21 and Eclipse, Infor, NetSuite, Acumatica, Sage, and QuickBooks Enterprise, plus CRM and e-commerce data where it adds context.