
Data modeling, DAX, and SQL that make your numbers agree
When finance, operations, and sales each have a different number for the same thing, the problem is usually the model underneath. We fix the logic so every report draws from one definition.

Signs your data model needs work
Dashboards are only as trustworthy as the logic behind them. These are the symptoms we see most often.
- Two reports show different revenue for the same month
- Reports are slow, time out, or fail to refresh
- Key formulas only make sense to one person
- Adding a new metric breaks old ones
What we deliver
Clean structure underneath means faster reports and fewer arguments on top.
Data models
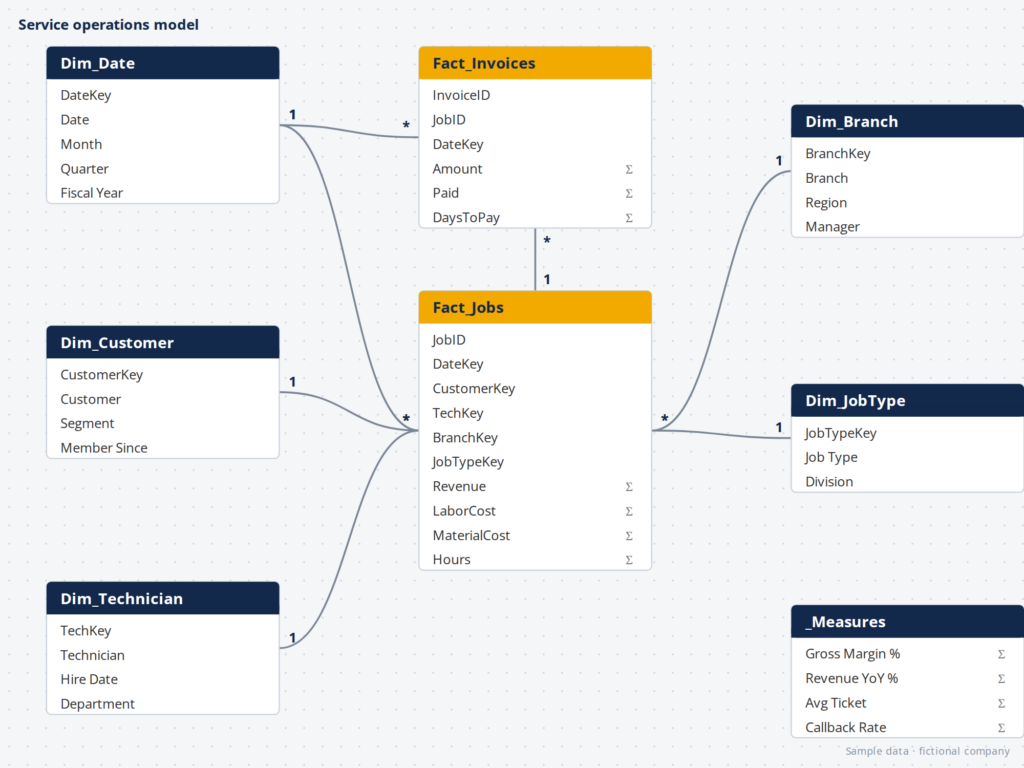
Star-schema models that make reports fast and calculations predictable.
DAX measure libraries
Reusable, documented measures for margin, utilization, growth, and more.
SQL views and logic
Business rules written once in the database instead of copied into every report.
Metric definitions
A plain-language glossary of what each number means and where it comes from.
Performance tuning
Faster refreshes and visuals through model, query, and storage improvements.
Validation checks
Tests that compare report totals against accounting so errors surface early.
How we approach it
1
Trace and reconcile
We find where numbers diverge and why, down to the specific rule or join.
2
Design the model
We lay out tables, relationships, and definitions and review them with you.
3
Rebuild and validate
We rebuild the logic and check results against your source systems.
4
Document definitions
Every metric gets written down so the next person can maintain it.
Common questions
Have a different question? Ask us directly.
Can you work inside our existing model?
Yes. Many projects start by fixing an existing Power BI or Tableau model rather than replacing it.
Which databases do you work with?
SQL Server, Azure SQL, Google BigQuery, PostgreSQL, and MySQL, plus Excel and Google Sheets when that’s where data lives.
Is this worth it if we only have a few reports?
Often yes. Fixing the definitions early prevents every future report from inheriting the same problems.
Related services
Dashboards built around the decisions your team makes every week.
Automated data movement into one central, historical warehouse.
So your team can read, use, and maintain its own reporting.
Start with a data audit
We’ll review your systems and current reports. You’ll leave with a clear plan for what to build first, whether we build it or not.
Prefer email? [email protected]